When we started building buy-vs-rent.com, one of the first decisions we had to make was which mortgage calculator we'd use as our data source — and potentially embed directly on our city analysis pages. We wanted something our readers could actually trust, not just a tool that spits out a monthly payment and calls it a day.
So we ran a pretty thorough evaluation. We performed a preliminary sweep of about 15 different calculators before narrowing down to a top five: four of the most well-known and widely-used homebuying tools on the internet, plus one we stumbled upon on the fourth page of a Google search. We stress-tested all of them with the same scenario — a $650,000 home in California, 20% down, 30-year fixed at 6.75%, married filing jointly on a $180,000 combined income — and pushed each one to see what it could and couldn't do. In our opinion, the gap between what these tools claim to offer and what they actually deliver is larger than most homebuyers realize.
Here's what we found — including a feature-by-feature breakdown and our honest takes on each tool.
The Feature Comparison Matrix
We looked at 28 features across three tiers. The idea was to separate the table-stakes basics that every calculator should have from the intermediate stuff that separates good tools from okay ones — and then the advanced features that we think represent what a genuinely useful homebuying tool should aspire to.
| Feature | True Home CostOur Pick | NerdWallet#2 | Bankrate#3 | SmartAsset#4 | Zillow#5 |
|---|---|---|---|---|---|
| Basic Features— The table stakes — every legitimate calculator should have these | |||||
| Monthly P&I calculation | |||||
| Adjustable loan term | |||||
| Down payment ($ and %) | |||||
| Property tax input | |||||
| Homeowner's insurance | |||||
| HOA fees | |||||
| PMI calculation | |||||
| Amortization table & chart | |||||
| Intermediate Features— Where the mainstream tools start to diverge | |||||
| Closing costs | |||||
| Maintenance cost estimates | |||||
| PMI auto-removal at 20% equity | |||||
| Auto-update on input change | |||||
| Location-based tax & insurance | |||||
| Shareable / deep-link URL | |||||
| Mobile-friendly layout | |||||
| Advanced Features— What separates a real financial planning tool from a payment estimator | |||||
| Federal income tax engine | |||||
| State income tax (all 50 states) | |||||
| Mortgage interest deduction check | |||||
| SALT deduction cap modeling | |||||
| After-tax monthly cost display | |||||
| Buy vs. rent net worth analysis | |||||
| Opportunity cost (invested down pmt.) | |||||
| ZIP code auto-fill | |||||
| Mortgage points modeling | |||||
| Extra payments + IRR calculator | |||||
| Refinance analyzer | |||||
| Solve-for logic (price / down / budget) | |||||
| Embeddable widget | |||||
#5 — Zillow Mortgage Calculator
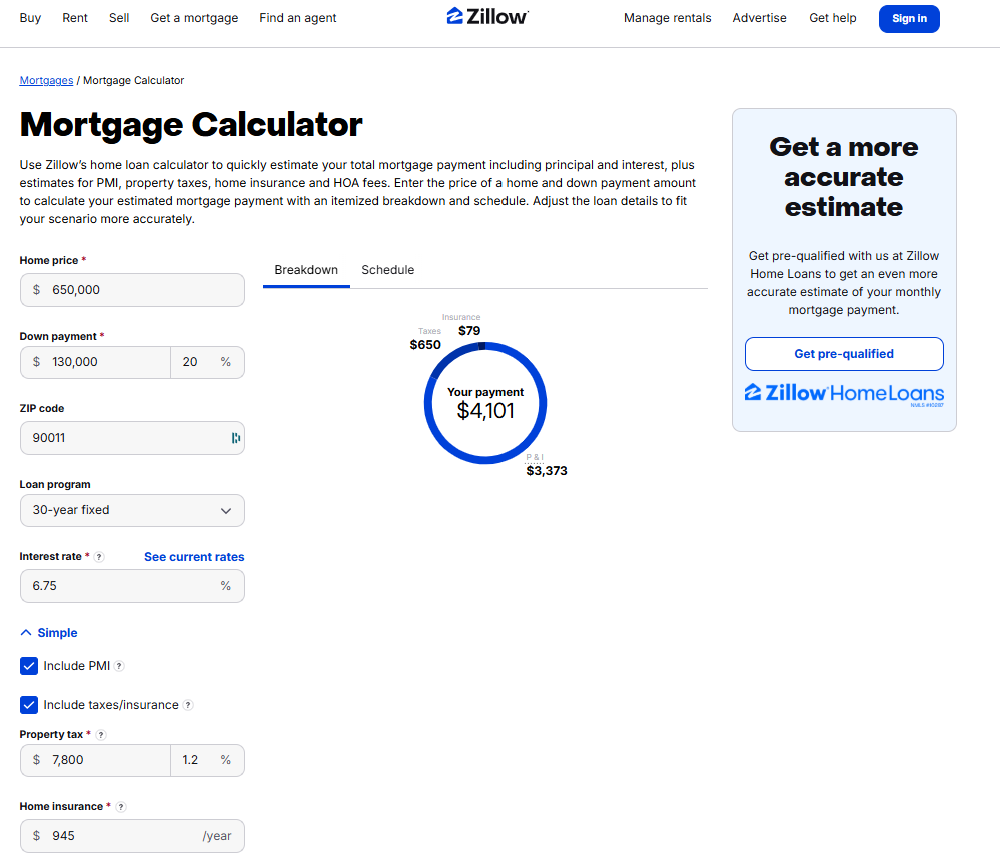
We want to be fair to Zillow here: their calculator is genuinely good at the specific thing it's designed to do. When you're browsing listings, it pre-populates the home price, estimated property tax, HOA fees, and insurance straight from the listing data — and it auto-calculates as you adjust inputs, which is a smooth experience. You get a monthly payment estimate in seconds without looking anything up. For someone scrolling through listings on a Saturday morning, we think that has real value.
The problems become apparent quickly once you want to make an actual decision. There's no amortization table, no closing cost estimator, and no buy vs. rent comparison. PMI shows up in the breakdown but there's no logic for when it comes off — the inflated payment just sits there indefinitely.
What surprised us most, though, was how little the ZIP code actually does. Entering a ZIP had no measurable effect on any of the defaults — not even property tax rates, which should vary significantly by location. More puzzling: when we adjusted the home price or down payment, the displayed interest rate sometimes changed, which isn't exactly confidence-inspiring behavior in a financial tool. The home insurance estimate is also strikingly low compared to what buyers in most markets actually pay — we'd estimate it's off by 30–50% in higher-cost states.
The deeper issue, and we say this gently, is that Zillow's calculator isn't really designed to help you think through a decision. It's designed to make buying feel concrete and achievable so you'll contact an agent. We're not criticizing that — it's a listing site and that's the model — but we think it's worth knowing the distinction when you're using it.
We'd suggest Zillow's calculator for: A quick gut-check on a listing you're about to tour. Nothing more.
We wouldn't use it for: Actual financial planning or any scenario requiring geographic accuracy.
#4 — SmartAsset Mortgage Calculator
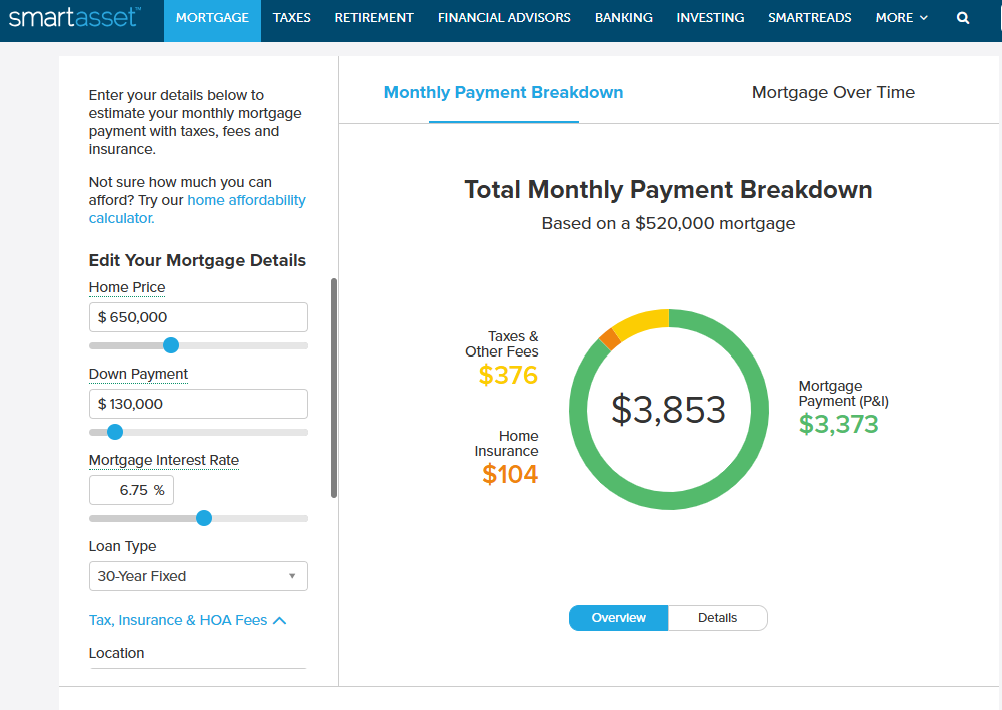
SmartAsset clearly targets a more financially aware audience than Zillow, and parts of the calculator reflect that. It uses city or county-level location data to auto-update property tax and insurance estimates as you type — which is a meaningful step up from tools that use flat national averages. There's a full amortization schedule, a closing cost estimator, and a debt-to-income ratio section that can be a useful sanity check for first-time buyers. We also want to highlight a feature we genuinely haven't seen elsewhere: SmartAsset shows you a recommended minimum savings and recommended minimum income for the purchase scenario you've entered. That kind of practical framing is helpful, and we'd love to see more tools adopt it. The instructional text at the bottom of the page is also a nice touch for users who aren't sure what they're looking at.
That said, we'd be doing you a disservice if we didn't mention the friction. The input layout relies on scroll boxes embedded within the panel itself, which creates a slightly disorienting experience — you're essentially scrolling inside a scroll. The interest rate slider moves in 0.1% increments, so to hit a specific rate like 6.75%, you'd have to type it in manually rather than drag to it. And you can't enter the down payment as a percentage — only as a dollar amount — which is a meaningful limitation for buyers who are thinking in terms of "what does 10% vs. 20% down actually mean for my monthly payment?"
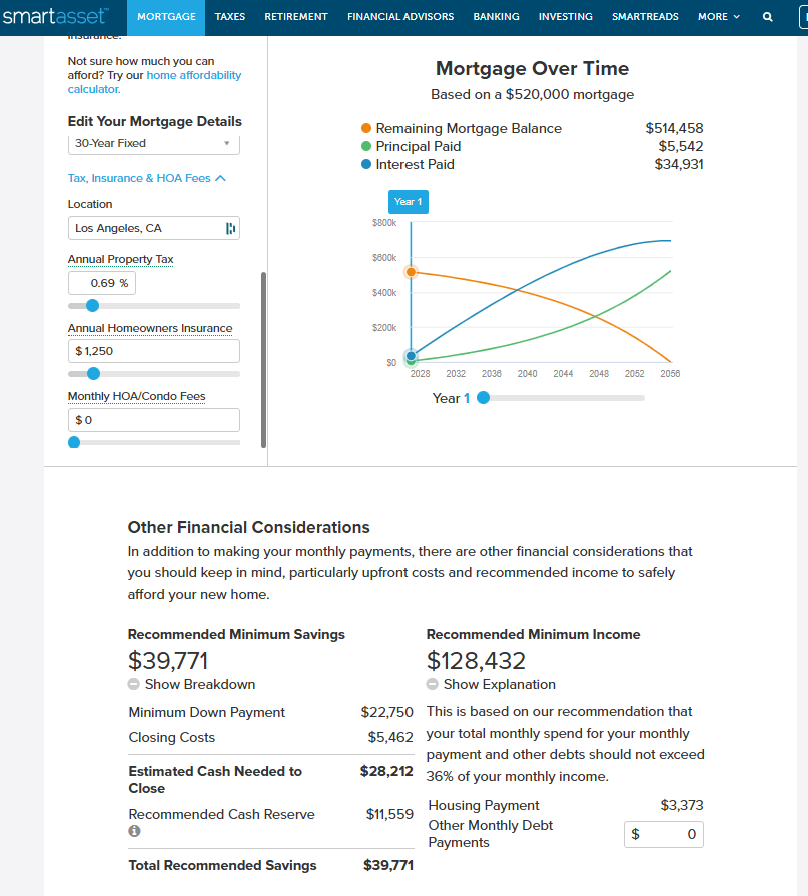
On top of that, there's no PMI calculation at all, even when a scenario clearly calls for it. Property tax and insurance estimates auto-update to your location, but in our testing both tended to undershoot reality, which means the total cost displayed is optimistic. Like the others in this tier, the buy vs. rent comparison is a cost tally rather than a wealth model — it doesn't account for what happens to your down payment if invested elsewhere.
We'd suggest SmartAsset for: Buyers who want location-aware defaults and a recommended affordability check alongside their calculation.
We wouldn't use it for: Precise PMI modeling, percentage-based down payment scenarios, or anyone who needs a smoother UX.
#3 — Bankrate Mortgage Calculator
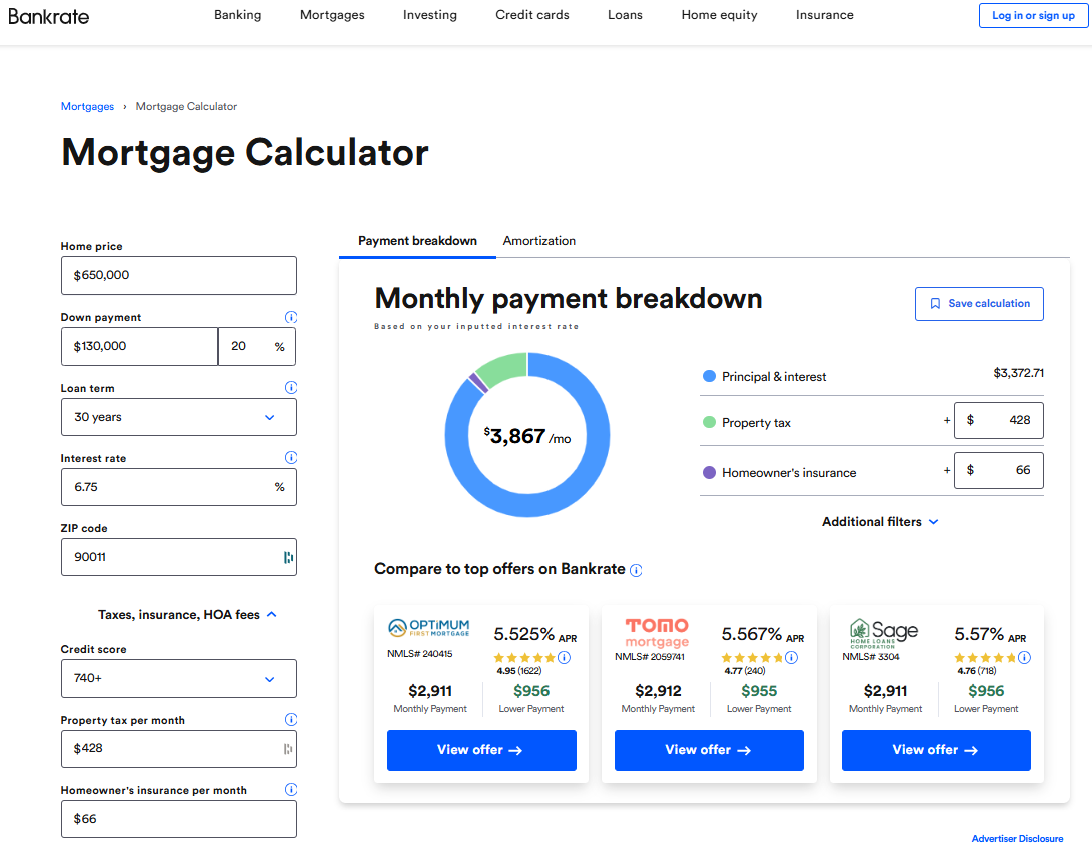
Bankrate earns the third spot because it's genuinely the most feature-complete of the big legacy financial media calculators. It clearly shows payoff date and total interest paid. The amortization visualization is interactive and well-labeled. We also appreciate that Bankrate can surface actual lender rate comparisons alongside your calculation — that kind of market context is something purely mathematical tools lack, and we think it's useful for buyers calibrating their assumptions against real rates.
That said, our experience with Bankrate was more frustrating than we expected. The calculator does not auto-update — you have to click a button to recalculate after changing any input, which disrupts the "play with the numbers" workflow that makes these tools useful. The ZIP code field exists but has no effect on any of the defaults, which we found misleading. Insurance estimates don't adjust for location or home price, and property tax defaults tended to undershoot what buyers actually pay in higher-cost markets. Perhaps most surprisingly for a tool at this tier: Bankrate doesn't automatically add PMI when the loan-to-value ratio exceeds 80%. You'd have to notice that on your own and input it manually — which is exactly the kind of thing first-time buyers are most likely to miss.
The extra payments feature is a genuine bright spot. It lets you see how additional payments shorten the payoff timeline and reduce total interest, and it's better implemented than most tools at this level.
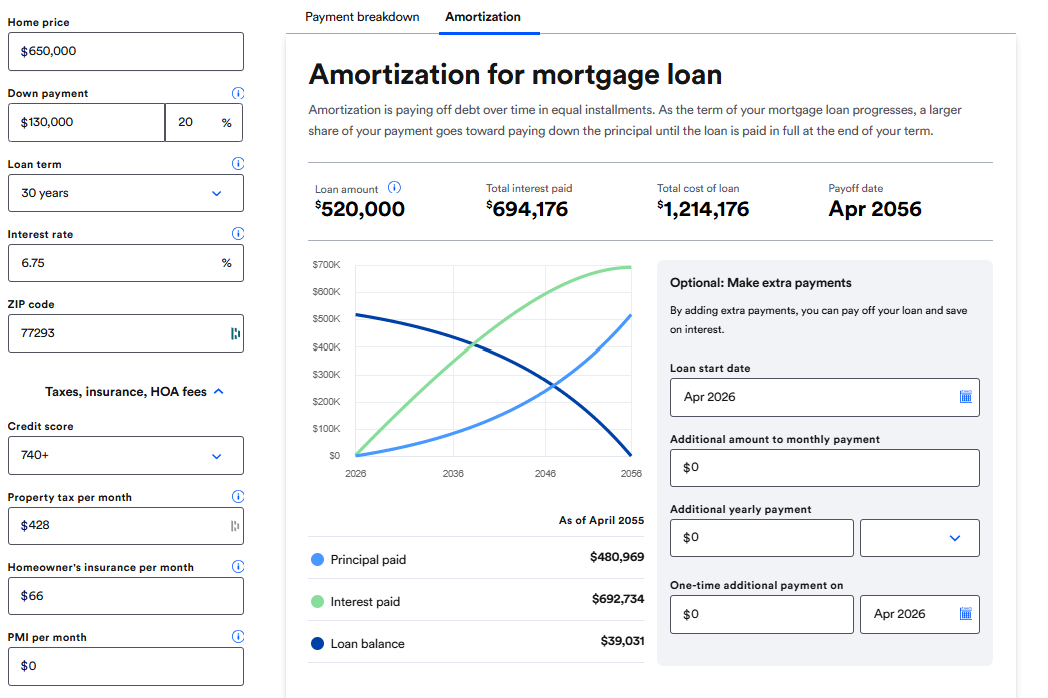
The refinance analyzer is a similar story: useful in isolation, but disconnected from everything else. The core problem with Bankrate is cohesion. The full suite exists — mortgage calculator, refinance calculator, amortization calculator, affordability calculator, extra payments calculator — but every single one lives on a separate page. When you're working through a real decision, re-entering the same inputs across multiple tools adds up. It feels like a collection of calculators assembled over a decade, not a system designed with a workflow in mind.
We'd suggest Bankrate for: Buyers who want current rate context alongside their calculation, and who don't mind a more manual, page-by-page workflow.
We wouldn't use it for: End-to-end scenario analysis, or any situation where PMI accuracy matters.
#2 — NerdWallet Mortgage Calculator
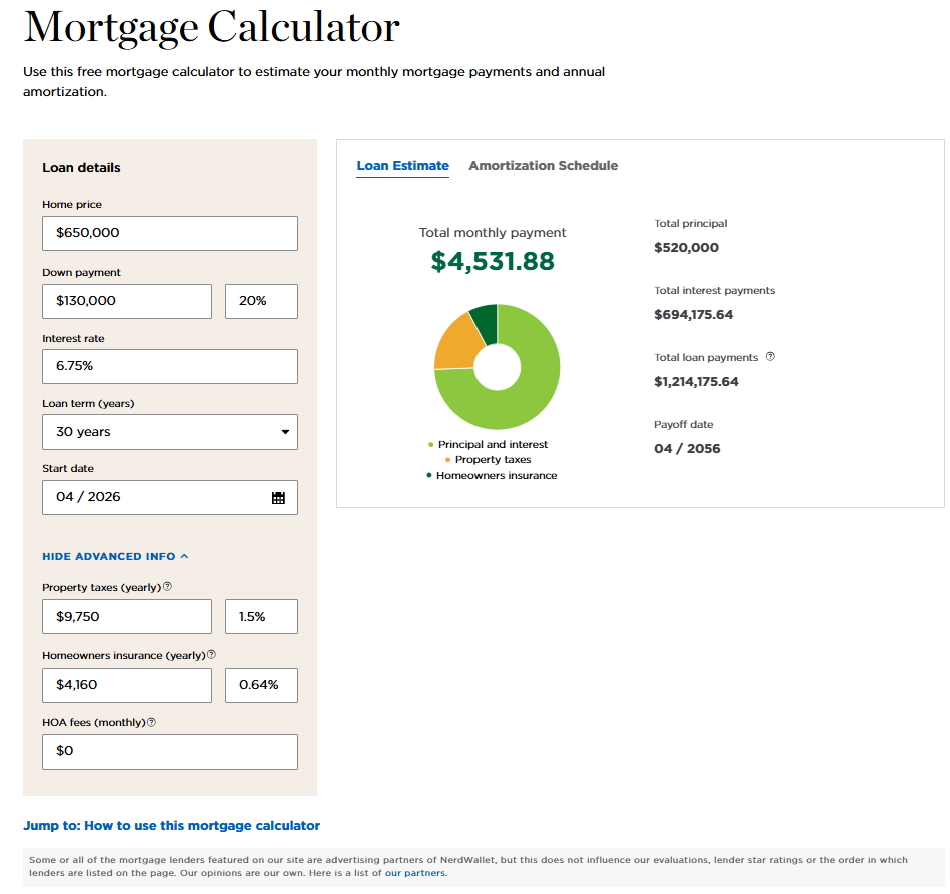
NerdWallet earns the second spot in our ranking, and honestly, it's the one we'd probably send a first-time buyer to if they weren't going to use our number one recommendation. The interface is clean and thoughtfully designed, inputs are well-labeled, and the experience holds up well on mobile. These things matter more than they sound — a confusing UI is its own kind of inaccuracy when it causes people to mis-enter numbers.
We think the closing cost estimator is one of NerdWallet's genuinely standout features. It breaks down the estimate by line item — origination fees, title insurance, government taxes, prepaid items — and lets you adjust each component. For first-time buyers who've never seen a loan estimate before, that breakdown is educational in a way most other tools don't attempt. We also appreciate that NerdWallet shows a loan start date and projected payoff date alongside the payment summary — a small touch that makes the timeline feel real rather than abstract.
We should note that NerdWallet's property tax rates and homeowner's insurance are defaulted as percentages of the home price, which is good except that they seem to have one default that does not change according to the entered location. It's a step up from Bankrate's flat estimates, but it still means the defaults can be meaningfully off depending on where you're buying. The closing cost and affordability calculators are also on separate pages — they're useful tools, but you'll need to re-enter your numbers to access them, which adds friction.
That said, we think NerdWallet hits a ceiling when buyers start asking more sophisticated questions. The buy vs. rent comparison compares costs without modeling wealth — it doesn't account for the opportunity cost of a down payment or produce a crossover year. And there's no income tax engine, which means the monthly cost displayed is a pre-tax number. For a buyer in California, New York, or New Jersey, we believe that gap can be worth hundreds of dollars a month.
We'd suggest NerdWallet for: First-time buyers who want a polished, educational experience with a solid closing cost breakdown.
We wouldn't use it for: Higher-income buyers, complex state tax situations, or anyone trying to model buy vs. rent as a wealth question.
#1 — True Home Cost Calculator
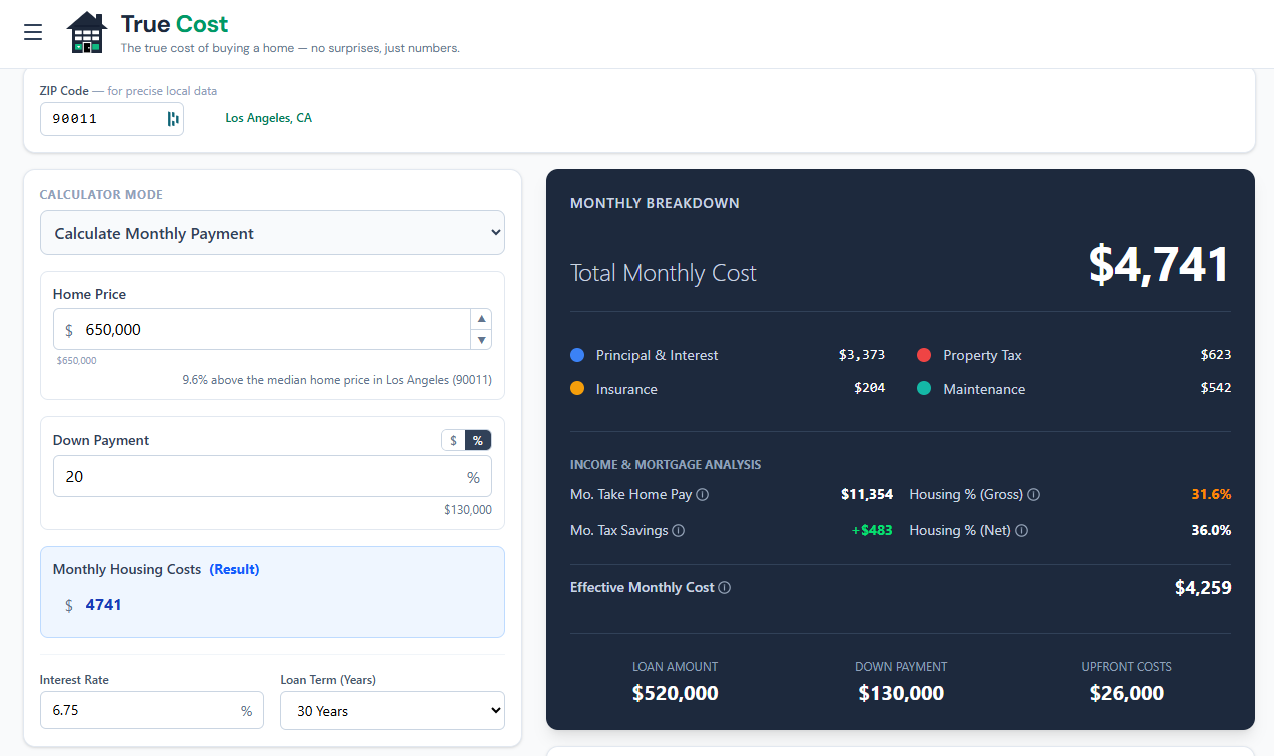
We'll be honest: when we started this evaluation, we expected to find that all five calculators were roughly equivalent for our purposes, and that we'd just pick the cleanest one to embed. We were wrong. Despite being the least well-known of the group — we found it on page four of a Google search, buried well below the household names — True Home Cost is in a different league, and by a wider margin than we ever anticipated.
Every other calculator in this list answers the question: what is my monthly payment? True Home Cost answers the question: what does this house actually cost me, how will it affect my finances over time, and what would my financial picture look like if I rented instead? In our opinion, those are fundamentally different questions, and the gap between them is what most homebuyers get wrong.
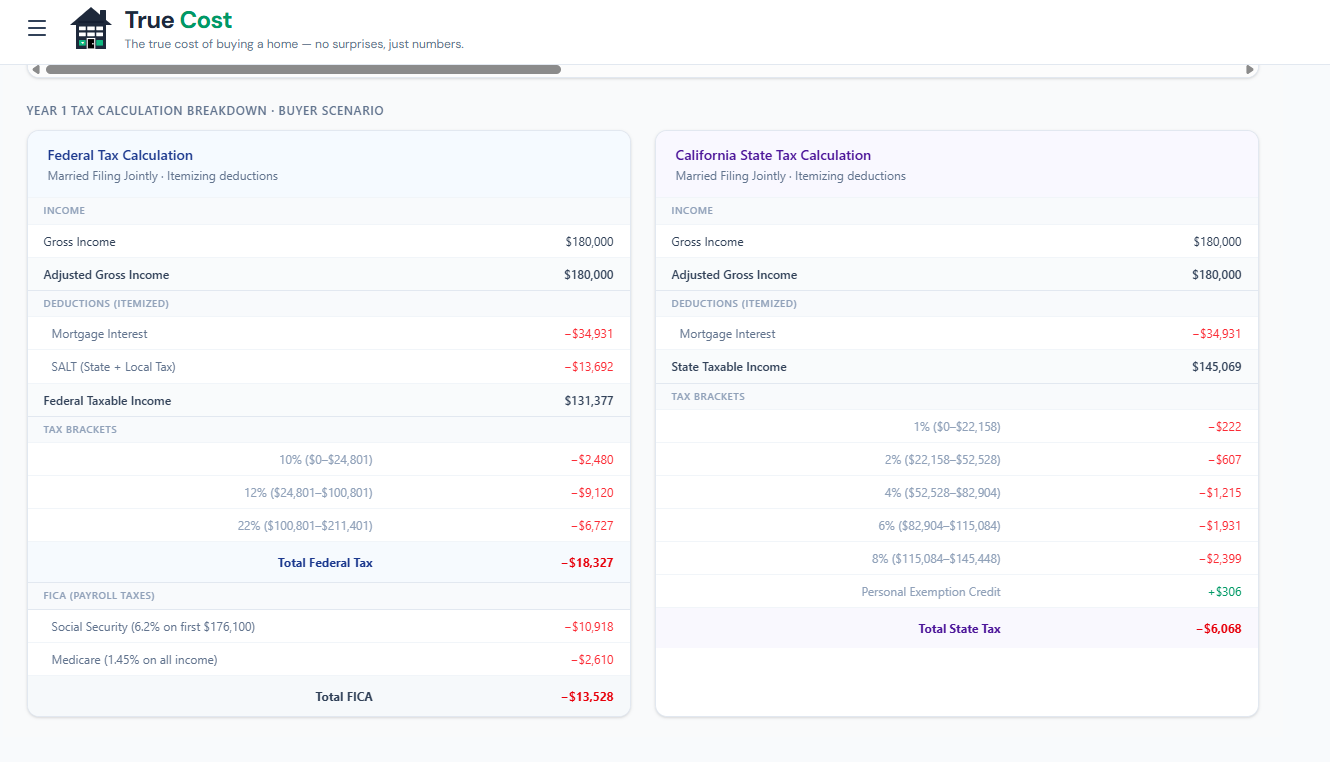
The Tax Engine
This is the feature that sets True Home Cost apart from everything else we tested, and we think it's underappreciated even by people who've already used the tool. It's not a simplified "you can deduct mortgage interest" checkbox. It's a full income tax calculation — federal brackets for 2026, plus state income tax for all 50 states, with support for all four filing statuses and pre-tax deductions like 401(k) contributions and HSA contributions.
The reason this matters: whether the mortgage interest deduction actually benefits you depends entirely on whether itemizing beats your standard deduction. A married couple in Texas on a modest-priced home might get zero benefit because the standard deduction is already higher than their total itemized deductions. A single high-earner buying in New York City might save several hundred dollars a month. True Home Cost calculates which situation applies to you, not which situation applies to a hypothetical average buyer.
It also handles genuinely complicated state-level rules. Florida, Texas, and Illinois don't allow a state mortgage interest deduction at all — so the calculator doesn't invent a benefit that doesn't exist. California caps the deduction at a $1 million mortgage balance. North Carolina has a $10,000 combined deduction cap. The SALT deduction cap is modeled correctly, including the phaseout schedule under current law. These details are tedious, but they're the details that determine whether your estimated tax benefit is real or fictional.
The end result is an effective after-tax monthly cost — what you actually net out of pocket per month, accounting for every tax benefit the law allows. We believe this is the number homebuyers should be working from, and we're genuinely frustrated that it took us this long to find a free tool that provides it.
Buy vs. Rent as a Wealth Question
We think the buy vs. rent analysis in True Home Cost is the most honest treatment of the question we've seen in any free tool. The core framing is right: your down payment isn't money you had to spend — it's capital with an opportunity cost. If you put $130,000 down on a home, that $130,000 is no longer compounding in the stock market. Over 10 or 20 years, that difference can be enormous, and most buy vs. rent tools just ignore it entirely.
True Home Cost models the renter's net worth (invested down payment plus monthly savings from lower housing costs, compounding at a configurable return rate) against the buyer's net worth (home equity minus transaction costs, with appreciation applied over time). The crossover year — where one path pulls ahead of the other — is the actual answer to the buy vs. rent question for your specific situation. You can adjust home appreciation, rent growth, investment return rate, and inflation, and the chart updates in real time to show how sensitive your outcome is to each assumption.
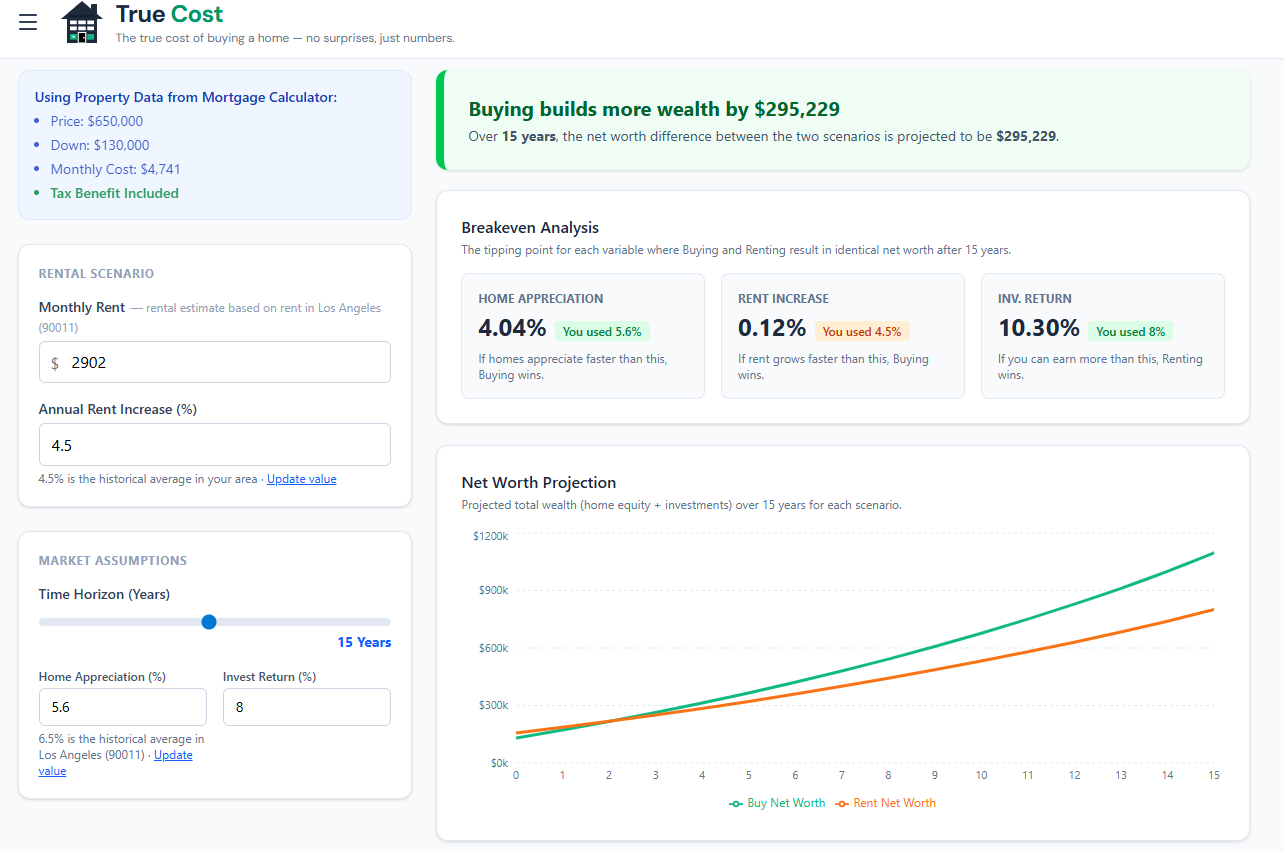
In our view, this is how the question should be analyzed. It's genuinely more complex than "is my mortgage payment close to my rent," and we're glad there's a tool that treats it that way.
ZIP Code Intelligence
We appreciated that True Home Cost doesn't make you do your own research just to get started. Enter your ZIP code and it auto-fills property tax rate, estimated rent (scaled to local median home value ratios — not just a national average), and homeowner's insurance (API-backed by state). The rent estimate in particular is thoughtfully done: it's proportional to what local renters actually pay relative to home values in that area, which matters a lot in markets where rent-to-price ratios vary widely. ZIP entry also automatically sets your state of residence for the tax engine — one less thing to get wrong.
Everything Else Worth Mentioning
The depth extends in every direction. Mortgage discount points have a full analyzer with a breakeven year and holding period sensitivity table. The extra payments section lets you model any combination of additional payment schedules, shows the interest saved and payoff date acceleration, and calculates the IRR of the extra payments so you can compare them against simply investing that money instead. The refinance tool is fully integrated — not a separate page — and handles cash-out scenarios, rolling closing costs into the new loan, and the net worth impact of refinancing. The solve-for logic lets you start from any constraint: enter a monthly budget and solve for maximum home price, or enter a target price and solve for required down payment.
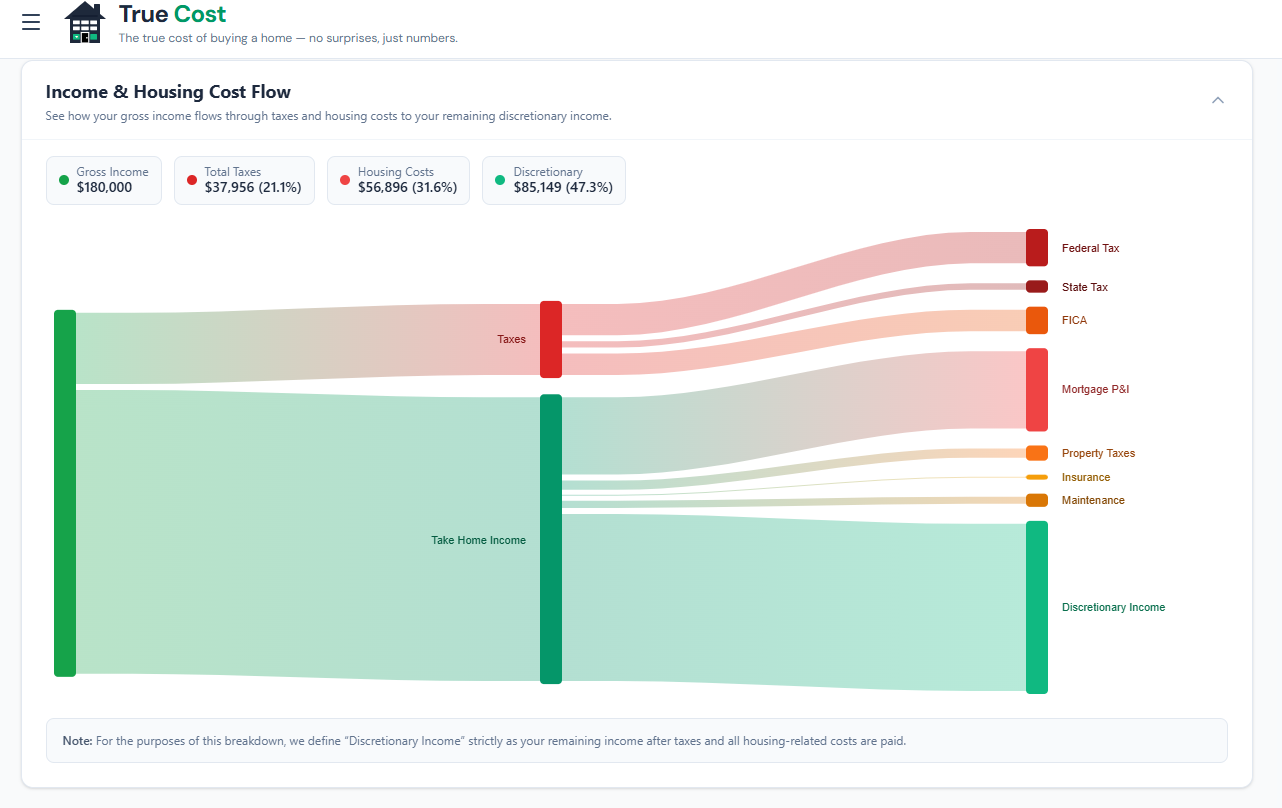
There are ten visualizations total. We want to single out the Sankey diagram in particular — it maps your full income flow from gross income through taxes and housing costs to take-home pay, and it's the clearest single-screen affordability summary we've seen anywhere.
Everything is lazy-loaded so performance is good on first load, and state persists across page reloads so you never lose a scenario you were working through.
We'd suggest True Home Cost for: Anyone who wants to genuinely understand what a home will cost them — not just the payment, but the full picture including taxes, opportunity cost, and long-term wealth trajectory.
Where We'd Love to See True Home Cost Improve
No tool is perfect, and since we chose True Home Cost as our partner, we want to be upfront about where we think there's still room to grow. These aren't deal-breakers — they're honest feedback from a team that uses this tool constantly.
City-based ZIP code search. Right now you need to know your ZIP code to use the geographic auto-fill features. We think a lot of buyers — especially those researching cities they haven't lived in — would benefit from being able to search by city name and then pick from a dropdown of relevant ZIP codes. It's a small UX change that would lower the barrier for early-stage research considerably.
More filing status depth. The two standard filing statuses are covered. But we'd love to see the tool go further — particularly for married filing separately, which can make sense for high-income couples in certain situations, and head of household with dependents. The more nuanced the tax inputs, the more accurate the after-tax cost becomes.
A dark mode UI. This might sound like a minor request, but we spend a lot of time in this calculator — and we suspect many serious homebuyers do too. A dark mode option would go a long way toward making extended planning sessions more comfortable. It's also something most modern web tools offer as standard.
More user education and in-context help. True Home Cost is built for buyers who already know what SALT caps and IRR mean. We think that's the right audience to design for. But we also believe there's a version of this tool that doesn't leave newer buyers behind. Better in-context tooltips, a glossary, or even a guided first-time buyer mode that explains each concept as you encounter it — any of these would help the tool serve a wider audience without sacrificing the depth that makes it valuable.
Why We Chose True Home Cost as Our Partner
The core problem with most mortgage calculators, in our opinion, is that they're built by publishers whose business model depends on you taking out a mortgage. The incentive is to make the numbers look manageable — not to give you a complete picture that might conclude "actually, renting would leave you wealthier for the next eight years."
We believe True Home Cost was built differently. The tax engine is real. The buy vs. rent model accounts for opportunity cost. The ZIP intelligence provides meaningful defaults without requiring a research session just to get started. And the embeddable widget means we can put that full analytical toolkit directly on our articles pages, so our readers can run their own scenarios against the same city data we publish.
That's why every analysis on buy-vs-rent.com is powered by True Home Cost data, and why you'll find their calculator embedded at the bottom of each of our city breakdowns. We looked at every alternative. There wasn't a close second.